Power BI and Business Central: Executive Dashboards That Drive Decisions

Laptop and tablet displaying business charts

Most leadership teams don’t suffer from a lack of data. They suffer from a lack of timely, trustworthy insight. Reports are assembled by hand in Excel, they arrive days after month-end, and every department has its own version of the truth. Combining Power BI with Business Central solves this: one data source, automatically refreshed dashboards, and the ability to drill from a KPI down to the underlying transaction.

Key takeaways for leaders

  • Microsoft provides ready-made Power BI apps for Business Central, covering Finance, Sales, Purchasing, Inventory, Projects and Manufacturing.
  • Since version 27 these apps are open source and support drill-back into Business Central, so they are easy to adapt.
  • Executive dashboards should focus on 8 to 12 KPIs that are linked to decisions, not on dozens of charts.
  • Real-time dashboards shorten the time between a problem appearing and management acting on it.
  • Data quality in Business Central determines the quality of every dashboard.

Ready-Made Power BI Apps for Business Central

Microsoft offers a set of Power BI apps that connect directly to Business Central:

  • Finance: income statement, balance sheet, cash flow, aged receivables and payables.
  • Sales: sales by customer, item, salesperson and period, with trends and margins.
  • Purchasing: spend analysis and vendor risk.
  • Inventory: stock levels, inventory value and expected future inventory flow.
  • Projects: project profitability and budget versus actual.
  • Manufacturing: production output, capacity and consumption.

With 2025 release wave 2 these apps were enhanced and open-sourced. They now support drill-back into Business Central and dynamic dimension names, which makes them a strong starting point for your own management reporting.

The KPIs Every Executive Dashboard Needs

  • Cash: cash position, 13-week cash forecast, days sales outstanding (DSO) and days payable outstanding (DPO).
  • Growth: revenue versus budget and last year, order intake and pipeline.
  • Profitability: gross margin by product line or customer group, and EBITDA trend.
  • Working capital: inventory turnover, slow-moving stock and overdue receivables.
  • Operations: on-time delivery, project margin and capacity utilisation.

Each KPI should have an owner, a target and a defined action when it moves outside its range. A dashboard nobody acts on is just decoration.

From Reports to Decisions

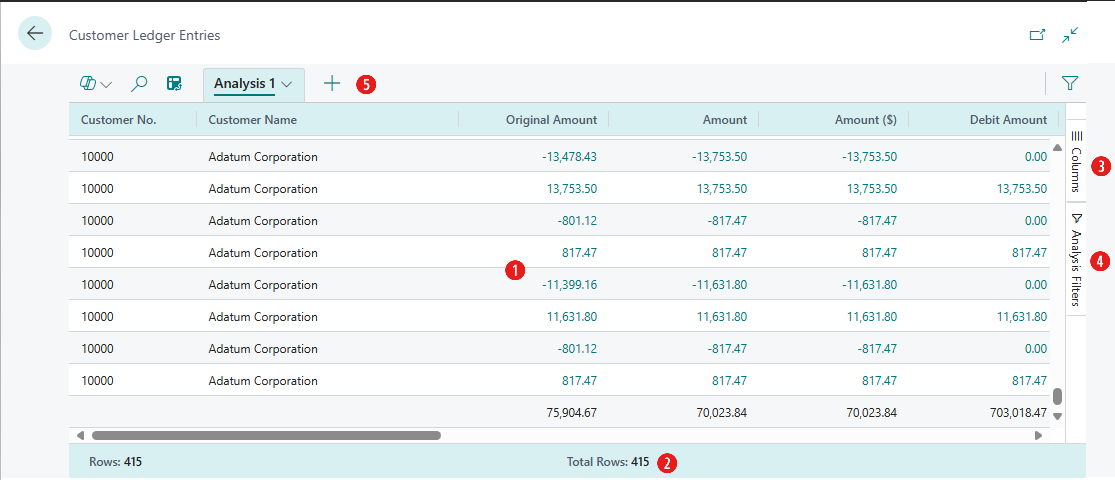
The real value of Power BI is not prettier charts but faster decisions. When the sales director sees on Monday morning that order intake in a region has dropped, they can act this week instead of after the monthly report. When the CFO sees DSO rising for a customer group, collection can start before it becomes a cash problem. Business Central’s analysis mode and Copilot analysis assist complement Power BI, allowing users to explore list data directly in Business Central without building a report.

Business Central analysis mode showing a list with grouping, totals and a columns pane
Analysis mode lets users explore list data directly in Business Central, without building a report. Source: Microsoft Learn, licensed under CC BY 4.0.

How to Get Started

  1. Define the questions leadership needs answered every week and every month.
  2. Install the standard Power BI apps and validate the figures with finance.
  3. Fix the data: consistent dimensions, item categories and customer groups are essential.
  4. Customise the apps for your KPIs, targets and budgets.
  5. Embed dashboards into Business Central Role Centres and Microsoft Teams, where people already work.

Our reporting and analytics services help you go from raw data to a dashboard leadership actually uses.

Frequently Asked Questions

Does Business Central include Power BI?

Business Central provides free Power BI apps and connectors. To share dashboards across your organisation, users typically need a Power BI Pro licence or your organisation needs a Power BI capacity.

Is Business Central data in Power BI real-time?

Power BI refreshes data on a schedule, for example several times a day. For most executive KPIs this is more than enough, and drill-back takes you to the live data in Business Central.

Can we customise the standard Power BI apps?

Yes. Since 2025 release wave 2 the Business Central Power BI apps are open source, so they can be adapted to your KPIs, dimensions and branding.

The combination of Business Central and Power BI turns your ERP from a system of record into a system of insight, and gives leadership the numbers they need when they need them.

Would you like to see what an executive dashboard on your own data could look like? Contact us or book a call with our analytics experts. You can also download our Power BI e-book from the e-books page.

Related reading

Sign up for monthly Business Central insights that help you get more value from your ERP.

Subscription Form
Scroll to Top

Let's fix this. Fast.

Leave your details and one of our Business Central experts will call you back usually within the same business day.

No sales pitch, just a straightforward conversation about your situation.